
Market Analysis for Monday, 2 November 2026
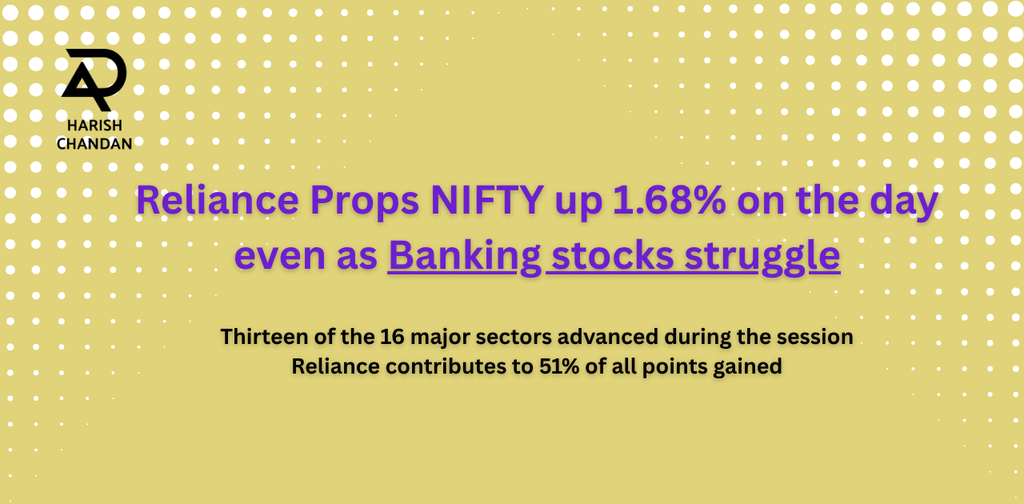
November has started on a strong note for Indian Equities. The NIFTY 50 surged 1.68% to close at 23,440.80, while the BSE Sensex advanced 1.66% to 75,692.78.
In the rally led by Reliance Industries(+11.60%) following better-than-expected quarterly earnings contributed to half of NIFTY’s total point gain. Easing crude oil prices and positive developments around geopolitical negotiations also supported investor sentiment.
However, there was an important divergence that continues to be see: BANK NIFTY advanced only 0.58%, failing to participate in the rally; this forms the basis for the Indian Stock Market Post-Market Analysis 02 Nov 2026.
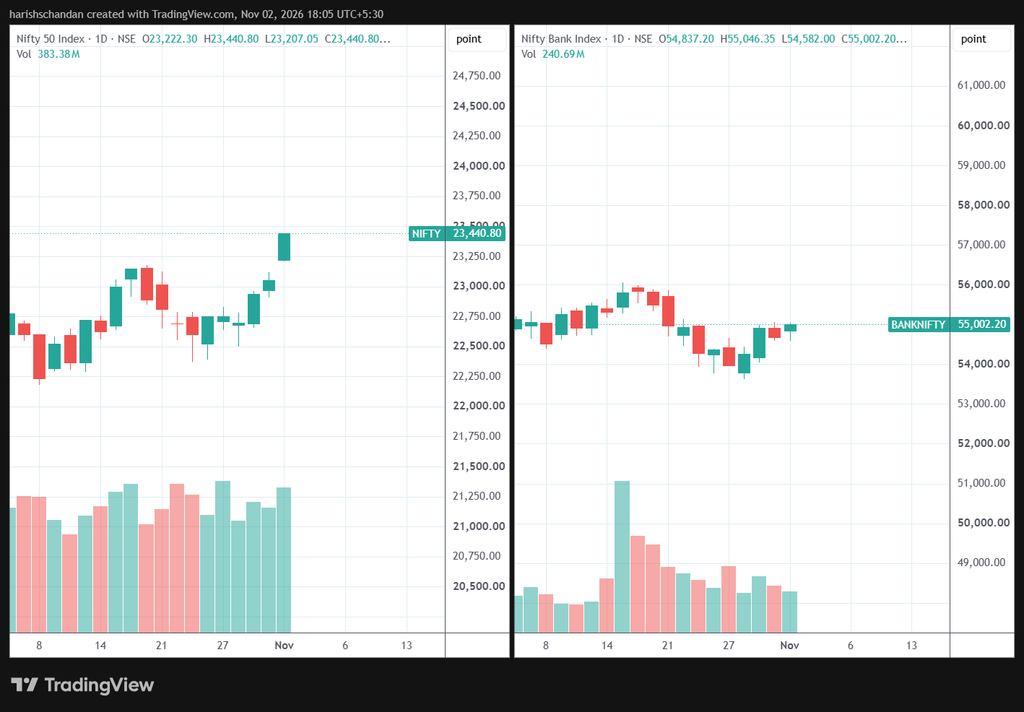
While the market has made a strong technical move; decisively breaking through the positive W structure it had been forming; the sustainability of this rally will depend on broader participation, banking-sector strength and institutional flows. Technically speaking, there are multiple resistance levels; one being in the range of today’s market close of 23,440.8; It may also face resistance at the Ichimoku cloud entry points (ref: chart); if this is indeed Wave 1 of a recovery however, it has potential to reach 24,000 levels (1.68%) but the broader markets need to participate for that to happen and the relative weakness in banking stocks will have to reverse.
Indian Stock Market Closing Snapshot – 2 November 2026
| Index | Closing Level | Daily Change |
| NIFTY 50 | 23,440.80 | +1.68% |
| BSE Sensex | 75,692.78 | +1.66% |
| NIFTY Bank | 55,002.2 | -0.58% |
What is the Upside Targets for NIFTY??
Upside targets of 23800, 23934 & subsequently 24100 open up with today’s move
How the markets moved on 2 November?
The NIFTY opened at 23,222.30 (104 points higher), already above the earlier resistance of 23,118 and carried forward the momentum on The index opened approximately 104 points above the earlier resistance and finished 322.70 points above it.
That is a decisive breakout of the earlier resistance levels identified. The earlier support zone of 22,905–22,936 was not tested during this session.
It remains a lower reference zone, while the former resistance around 23,118 could become a support area if the market successfully retests and holds above it.
Our assessment: The NIFTY has delivered the bullish follow-through we were looking for. The next question is whether it can sustain these higher levels without relying excessively on a handful of heavyweight stocks.
What Drove Today's Rally?
Reliance Industries
RIL stock surged 11.60% following better-than-expected quarterly earnings - The strongest single-day gain since April 2020.
By itself, Reliance contributed approximately 198 points or 51% to the NIFTY's 387.70-point advance. This is a significant concentration of index performance
Brent crude down approximately (- 7.63%) giving a Positive macroeconomic trigger
13 of 16 sectors advanced - Broader participation
Auto stocks: Auto shares attracted buying interest on optimism around monthly sales.
Metals: Metal stocks also participated in the broader rally.
IT stocks: The sector experienced some profit-taking following its strong October performance.
66.7% of traded NSE stocks advanced providing for a Positive market breadth
FIIs previously held substantial net shorts and a part of the rally must also be attributed to short covering
Geopolitical developments: Hopes of progress in negotiations involving Iran and regional stakeholders helped ease concerns about energy supply disruptions.
The positive participation across sectors is encouraging, although Reliance's contribution means that the headline NIFTY performance was significantly influenced by one stock.
BANK NIFTY: The Divergence That we must not ignore
While the NIFTY 50 advanced 1.68% on 2 November, BANK NIFTY declined 0.06%. This represents an underperformance of approximately 1.74 percentage points in a single session. The weakness is also visible when we compare performance over the preceding week.
NIFTY versus BANK NIFTY (pre-CAS data hereon out)
| Period | NIFTY 50 | BANK NIFTY |
| 26–30 October | +2.00% | +0.74% |
| 2 November | +1.68% | -0.06% |
| 23 October–2 November | +3.72% | +0.68% |
Since 23 October, the NIFTY has gained approximately 3.72%, compared with just 0.68% for BANK NIFTY (pre-CAS data hereon out)
The difference of 3.04 percentage points is not nothing. This is a meaningful divergence.
Given that financial services account for approximately 35–37% of the NIFTY 50, continued weakness in heavyweight banking stocks could constrain the benchmark's ability to sustain further gains.
BANK NIFTY is showing clear relative weakness against the NIFTY. We would like to see sustained participation from major private-sector banks and public-sector banks before treating the broader market recovery as fully confirmed.
FII/DII Activity: The Next Important Confirmation
Institutional flows will be particularly interesting to watch after today's strong market performance.
The latest cash-market figures available for reference are from Friday, 30 October.
| Particulars | FII/FPI | DII |
| Net activity – 30 October | +₹3,598.54 Cr | -₹817.51 Cr |
| Net activity – 26–30 October | +₹6,304.67 Cr | +₹3,109.79 Cr |
| October net activity | -₹45,161.71 Cr | +₹62,220.11 Cr |
The final week of October saw both FIIs and DIIs as net buyers in the cash market. However, the monthly picture was different. FIIs remained net sellers, while DIIs provided substantial support through domestic institutional buying.
Further data on the FII / DII activity will give us more clarity on the positioning of the big players.
Today’s FII/DII Data is unavailable presently, we will attempt to update it once it is available.
Key Corporate Results to Watch
The September-quarter earnings season continues, and several companies are scheduled to consider their financial results over the next few sessions.
The following dates are based on the NSE corporate filings event calendar.
| Date | Companies to Watch | Sector |
| 3 November | Bajaj Finserv | Financial Services |
| 3 November | Bajaj Holdings & Investment | Financial Services |
| 3 November | Emcure Pharmaceuticals | Pharmaceuticals |
| 3 November | Endurance Technologies | Auto Components |
| 3 November | GlaxoSmithKline Pharmaceuticals | Pharmaceuticals |
| 3 November | Zydus Wellness | Consumer / Healthcare |
| 4 November | Apollo Hospitals | Healthcare |
| 4 November | BSE Limited | Capital Markets |
| 4 November | Cummins India | Capital Goods |
| 4 November | Dabur India | FMCG |
| 4 November | Lenskart Solutions | Retail |
| 4 November | NHPC | Power |
| 4 November | Zydus Lifesciences | Pharmaceuticals |
| 5 November | Mahindra & Mahindra | Automobiles |
| 5 November | Life Insurance Corporation of India | Insurance |
| 5 November | Mphasis | IT Services |
| 5 November | Thermax | Capital Goods |
| 6 November | Hindalco Industries | Metals |
To look for continued positivity, we should look forward to seeing -
- The NIFTY sustain its breakout above the earlier resistance zone.
- Banking stocks begin participating more meaningfully.
- Broader market strength continue.
- FII/DII cash flows confirm sustained institutional buying.
- Corporate earnings support the current improvement in sentiment.
The NIFTY has broken resistance thanks to Reliance. The next test is whether the rest of the market can keep up.
Research Analyst Details
S. Harish Chandan
SEBI Registered Research Analyst
SEBI Registration No.: INH000012768
BSE Enlistment No.: 5826
Website: https://raharishchandan.com
Contact: +91 88944 66882
Disclaimer
This market commentary is prepared for informational and analytical purposes only. It is not an offer, solicitation or recommendation to buy, sell or hold any securities or financial instruments.
The views and observations expressed are based on publicly available information and market data considered at the time of preparation. Market conditions can change, and past performance is not indicative of future results.
Investors should conduct their own due diligence and consult their financial advisers before making investment decisions. Derivatives and leveraged trading involve substantial risk and may not be suitable for all investors.
Please refer to the applicable research disclosures and terms published on our website.
Reference Websites for further data:
NSE India – Live Equity Market: https://www.nseindia.com/market-data/live-equity-market
NSE India – Historical Index Data: https://www.nseindia.com/reports-indices-historical-index-data
NSE India – Participant-wise Open Interest: https://www.nseindia.com/all-reports-derivatives
NSE India – Option Chain: https://www.nseindia.com/option-chain
NSE Indices – NIFTY 50 Factsheet: https://www.niftyindices.com/Factsheet/ind_nifty50.pdf
NSE India – Corporate Filings and Financial Results: https://www.nseindia.com/companies-listing/corporate-filings-financial-results
Reliance Industries – Investor Relations: https://www.ril.com/investors
BSE India – Corporate Announcements: https://www.bseindia.com/corporates/ann.html
SEBI – Official Website: https://www.sebi.gov.in/
NSDL – FPI Investment Statistics: https://www.fpi.nsdl.co.in/web/Reports/Latest.aspx
CDSL – FPI Statistics: https://www.cdslindia.com/Publications/ForeignPortInvestor.html
PPAC (Petroleum Planning & Analysis Cell), Ministry of Petroleum & Natural Gas: https://ppac.gov.in/
Ministry of Commerce & Industry – Trade and Economic Data: https://commerce.gov.in/
RBI – Database on Indian Economy: https://data.rbi.org.in/
