
S Harish Chandan | 2 November 2026
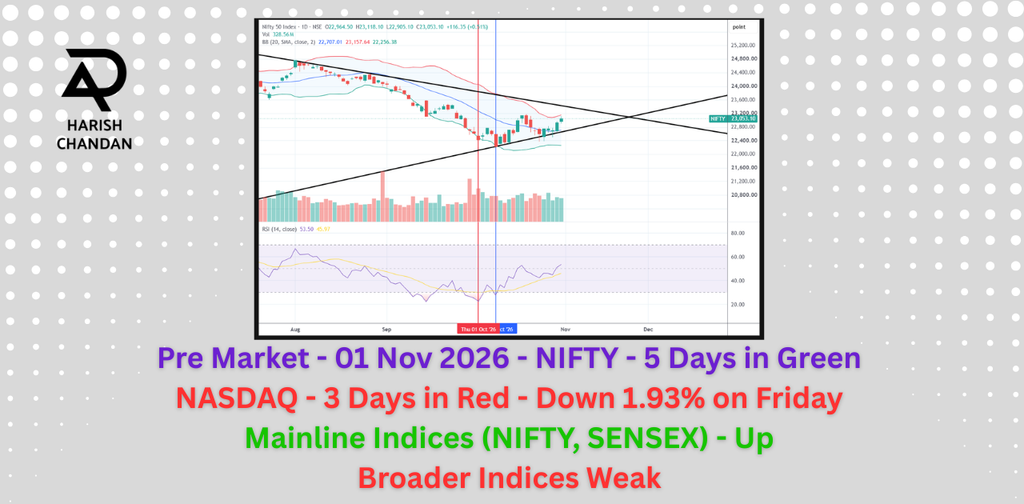
Pre Market Snapshot of 2 November 2026: Friday, 02 Nov 2026 with data from 30 Oct 2026
Market: Indian securities markets
Indian equity markets ended the final trading session of October on a positive note, with the NIFTY 50 reclaiming the 23,000 mark and the Sensex closing higher. Buying in IT, pharma and healthcare stocks supported the benchmark indices. Broader markets however -the Mid-cap and small-cap indices declined sharply during Friday’s session, while several sectors remained under pressure.
NIFTY's October performance is showing an important divergence: the NIFTY 50 and Sensex recorded monthly gains, but mid-cap and small-cap indices ended the month lower. The strong performance of IT stocks provided meaningful support to the headline indices, while market breadth remained weak.
Overseas, US technology stocks faced renewed selling pressure on Friday, adding another factor for Indian investors to monitor as the new trading week begins.
Indian Stock Market: Key Highlights
- NIFTY 50: Closed at 23,053.10, gaining 116.35 points (+0.51%).
- Sensex: Closed at 74,459.53, gaining 308.49 points (+0.42%).
- Bank NIFTY: Declined 222.70 points (-0.41%) to 54,686.95.
- NIFTY Midcap 100: Fell 0.93%.
- NIFTY Smallcap 100: Declined 1.85%.
- Top-performing sectors: IT (+2.32%), Healthcare (+1.58%) and Pharma (+1.55%).
- India VIX: Rose 1.19% to 15.30.
- October performance: NIFTY 50 gained 1.91%, while the Sensex advanced 2.73%.
The key takeaway is that buying in selected large-cap stocks helped the benchmarks close higher, but the weakness across broader market segments warrants attention.
Indian Market Closing Report – 30 October 2026
| Index | Closing Level | Daily Change |
| NIFTY 50 | 23,053.10 | +0.51% |
| BSE Sensex | 74,459.53 | +0.42% |
| NIFTY Bank | 54,686.95 | -0.41% |
| NIFTY Midcap 100 | 57,301.25 | -0.93% |
| NIFTY Smallcap 100 | 18,463.60 | -1.85% |
The NIFTY 50 traded between 22,905.10 and 23,118.10 before settling above 23,000.
While the frontline indices ended higher, the decline in Bank NIFTY and the broader market indices indicates that buying was not evenly distributed across the market. This is an important distinction. A positive closing figure for the NIFTY 50 does not necessarily indicate broad-based market strength.
Weekly Market Performance: 26–30 October 2026
Indian markets recovered during the final trading week of October, following a weak previous week.
| Index | 23 October Close | 30 October Close | Weekly Change |
| NIFTY 50 | 22,600.00 | 23,053.10 | +2.00% |
| Sensex | 73,123.83 | 74,459.53 | +1.83% |
| NIFTY Bank | 54,287.35 | 54,686.95 | +0.74% |
| NIFTY Midcap 100 | 55,800.65 | 57,301.25 | +2.69% |
| NIFTY Smallcap 100 | 17,739.45 | 18,463.60 | +4.08% |
The recovery was particularly visible in the mid-cap and small-cap indices, which gained 2.69% and 4.08%, respectively.
However, the rebound needs to be viewed in context. During the previous week, the NIFTY 50 had declined approximately 2.36%. The latest week's gain therefore represents a recovery, rather than conclusive evidence that the broader correction is over.
Our assessment: The weekly recovery is encouraging, but we would prefer to see sustained participation across banking, mid-cap and small-cap stocks before treating it as a stronger market-wide trend.
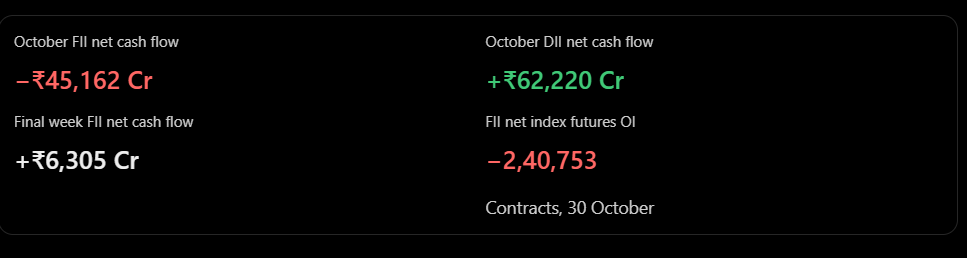
October 2026: Monthly Market Performance
October ended with gains in the headline indices, although the broader market remained under pressure and the divergence can be seen clearly in the below data -
| Index | 30 September Close | 30 October Close | Monthly Change |
| NIFTY 50 | 22,620.45 | 23,053.10 | +1.91% |
| Sensex | 72,480.29 | 74,459.53 | +2.73% |
| NIFTY Bank | 54,633.05 | 54,686.95 | +0.10% |
| NIFTY Midcap 100 | 59,332.05 | 57,301.25 | -3.42% |
| NIFTY Smallcap 100 | 19,245.70 | 18,463.60 | -4.06% |
| NIFTY 500 | 22,072.10 | 21,895.90 | -0.80% |
The NIFTY 50 gained 1.91%, while the Sensex advanced 2.73%. In contrast, the NIFTY Midcap 100 declined 3.42% and the NIFTY Smallcap 100 fell 4.06%. These are assuredly not small declines and hence need our attention.
Bank NIFTY also was almost unchanged, gaining just 0.10%.
This suggests that October's gains were concentrated in selected large-cap stocks rather than being supported by the broader market.
Sectoral performance during October
The IT sector was the standout performer, gaining 17.69% during the month.
| Sector / Index | October Change |
| NIFTY IT | +17.69% |
| NIFTY MidSmall IT & Telecom | +7.50% |
| NIFTY India Digital | +7.17% |
| NIFTY Services | +6.37% |
| NIFTY Media | +3.03% |
| NIFTY PSU Bank | +2.73% |
| NIFTY Small Finance Banks & Microfinance | -17.70% |
| NIFTY Sugar & Ethanol | -10.28% |
| NIFTY NBFC | -8.74% |
| NIFTY Construction | -7.94% |
| NIFTY Metal | -7.65% |
The strength in IT stocks stands out, particularly when compared with the weakness in financial and other cyclical segments. The divergence also reinforces why investors should look beyond headline index returns when assessing market conditions.
Across the NSE main-board universe, approximately 2,134 stocks declined, compared with 481 advancing stocks. Within the NIFTY 500, 376 stocks declined while 121 advanced. In other words, the majority of stocks did not participate in the benchmark indices' monthly gains.
Our assessment: October was a month of selective strength, not a broad-based market rally. Investors should be cautious about interpreting benchmark performance as a reflection of the wider equity market.
Sectoral Performance on 30 October
IT, healthcare and pharma stocks led the market on the final trading day of October.
| Sector | Daily Change |
| NIFTY IT | +2.32% |
| NIFTY Healthcare | +1.58% |
| NIFTY Pharma | +1.55% |
| NIFTY Bank | -0.41% |
| NIFTY Oil & Gas | -0.47% |
| NIFTY Metal | -0.54% |
| NIFTY FMCG | -0.62% |
| NIFTY Realty | -0.72% |
| NIFTY Auto | -0.87% |
The IT sector's strength helped support the benchmark indices. However, weakness across auto, realty, metals and other sectors limited broader participation.
The divergence between IT and other market segments remains an important trend to monitor.
NIFTY 50: Top Gainers and Losers – 30 October 2026
Top gainers
| Stock | Closing Price | Change |
| Trent | ₹3,017.30 | +5.44% |
| InterGlobe Aviation (IndiGo) | ₹4,877.60 | +4.33% |
| Infosys | ₹1,185.00 | +3.36% |
| Apollo Hospitals | ₹8,448.00 | +3.02% |
| Power Grid | ₹265.00 | +1.92% |
Top losers
| Stock | Closing Price | Change |
| Shriram Finance | ₹823.15 | -2.13% |
| Nestlé India | ₹1,167.00 | -1.82% |
| Mahindra & Mahindra | ₹2,840.30 | -1.72% |
| Jio Financial Services | ₹204.50 | -1.21% |
| Adani Ports | ₹1,850.00 | -1.18% |
The performance of IT and selected consumption-related stocks supported the market, while selling in financial and other heavyweight counters limited the upside.
The table reflects selected NIFTY 50 constituents and is not a recommendation to buy or sell any security.
US Markets: Technology Stocks Face Renewed Selling Pressure
US equity markets ended Friday, 30 October, sharply lower, with technology stocks leading the decline.
| US Index | Closing Level | Daily Change |
| S&P 500 | 7,580.07 | -1.82% |
| Dow Jones Industrial Average | 51,770.31 | -1.09% |
| NASDAQ Composite | 25,437.00 | -2.86% |
| Russell 2000 | 2,811.84 | -1.66% |
The NASDAQ was the weakest among the major indices, declining 2.86% on Friday. It had also fallen 1.38% on Thursday, 29 October.
For context, the NASDAQ had gained 0.27% on 28 October before the subsequent two-session decline. From its 28 October close to 30 October, it lost approximately 4.19%.
What triggered the selling?
Concerns around elevated technology valuations and the scale of artificial intelligence-related spending weighed on investor sentiment.
Some of the notable stock movements included:
- Intel: Fell approximately 28.58% after its profit outlook disappointed investors.
- NVIDIA: Declined approximately 4.22%.
- AMD: Fell approximately 10.88%.
Amazon's earnings also renewed questions about the scale of investment required to build and operate AI infrastructure.
The broader concern is not necessarily that investors have lost confidence in artificial intelligence. Rather, markets are increasingly scrutinising the cost of investment, the pace of returns and the valuations assigned to companies expected to benefit from AI.
What does this mean for Indian markets?
The weakness in US technology stocks is relevant for Indian IT companies and investor sentiment towards technology shares.
However, the relationship is not automatic. Indian IT stocks may respond differently depending on their valuations, earnings outlook, client exposure and domestic market conditions.
We will be watching whether the US technology sell-off translates into weakness in Indian IT stocks or whether domestic buying interest continues to support the sector.
India VIX: Volatility Edges Higher
India VIX closed at 15.30, rising 1.19% during Friday's session. The volatility index also ended October approximately 13.42% higher than its September closing level. A rising India VIX indicates an increase in the market's expected volatility. Overall, we still need to continue to be cautious with our expectations and / or investments.
Technical Market View: Levels to Watch
The NIFTY 50 ended the week at 23,053.10, reclaiming the psychologically important 23,000 level.
For the immediate session, Friday's trading range provides the first reference points:
- Immediate support reference: 22,905–22,936, around Friday's intraday low and previous close.
- Immediate resistance reference: 23,118, around Friday's intraday high.
- Key psychological level: 23,000.
A sustained move above Friday's high would improve the immediate price structure. Conversely, a move below the 23,000 zone would require monitoring for renewed selling pressure.
What Should Investors and Traders Watch This Week?
As Indian markets begin November, we believe the following factors deserve attention:
- US technology stocks: Whether the recent NASDAQ decline continues and how global technology sentiment responds.
- Indian IT stocks: Whether the sector can sustain its strong October performance.
- Banking stocks: Bank NIFTY's monthly gain of just 0.10% highlights the need for stronger participation from banking stocks.
- Mid-cap and small-cap stocks: Whether the recent recovery can develop into sustained strength after October's monthly declines.
- India VIX: Whether volatility continues to rise.
- Corporate earnings: Results, management commentary and forward guidance will remain important drivers of individual stock performance.
- Crude oil and geopolitical developments: Changes in energy prices and geopolitical risk could influence inflation expectations and market sentiment.
Our Market AssessmentBenchmark indices ended higher: NIFTY 50 gained 1.91%, while the Sensex advanced 2.73% during October.
Broader markets underperformed: NIFTY Midcap 100 declined 3.42% and Smallcap 100 fell 4.06%.
IT led the rally: The NIFTY IT index surged 17.69%, providing significant support to headline indices.
Market participation remained weak: Gains were concentrated in select stocks, rather than being broad-based.
Weekly recovery offered some relief: NIFTY 50 gained 2.00% in the final week, but a sustained reversal is yet to be established.
Banking participation needs monitoring: Stronger performance from banking stocks would help improve confidence in the broader market.
Traders should watch volatility and sector rotation, while investors should remain focused on valuations, stock selection and earnings growth.
Author / Research Analyst Details
S. Harish Chandan
SEBI Registered Research Analyst
SEBI Registration No.: INH000012768
BSE Enlistment No.: 5826
Website: https://raharishchandan.com
Contact: +91 88944 66882
Disclaimer
This market commentary is prepared for informational and analytical purposes only. It is not an offer, solicitation or recommendation to buy, sell or hold any securities or financial instruments.
The views and observations expressed are based on publicly available information and market data considered at the time of preparation. Market conditions can change, and past performance is not indicative of future results.
Investors should conduct their own due diligence and consult their financial advisers before making investment decisions. Derivatives and leveraged trading involve substantial risk and may not be suitable for all investors.
The research analyst may have positions or interests in securities discussed in this commentary, where applicable, and relevant disclosures should be referred to before acting on any security-specific research.
Please read the applicable research disclosures and terms on the website before relying on this commentary.
Research Analyst Details
S. Harish Chandan
SEBI Registered Research Analyst
SEBI Registration No.: INH000012768
BSE Enlistment No.: 5826
Website: https://raharishchandan.com
Contact: +91 88944 66882
Disclaimer
This market commentary is prepared for informational and analytical purposes only. It is not an offer, solicitation or recommendation to buy, sell or hold any securities or financial instruments.
The views and observations expressed are based on publicly available information and market data considered at the time of preparation. Market conditions can change, and past performance is not indicative of future results.
Investors should conduct their own due diligence and consult their financial advisers before making investment decisions. Derivatives and leveraged trading involve substantial risk and may not be suitable for all investors.
The research analyst may have positions or interests in securities discussed in this commentary, where applicable, and relevant disclosures should be referred to before acting on any security-specific research.
Please read the applicable research disclosures and terms on the website before relying on this commentary.
